
THAI DEVELOPER EBITDA MARGINS: 2024 FINANCIAL BENCHMARKS YOUR INVESTMENT COMMITTEE NEEDS
Understanding real Thai developer EBITDA margins and Thailand real estate financial benchmarks is critical for any investment committee evaluating Southeast Asian property exposure in 2026. Standard benchmarking reports suggest that real estate profit margins Thailand developers enjoy run at a healthy 25% to 30%. However, Datagent’s Q1 2026 TSIC 68 financial analysis tells a fundamentally different story. Actual developer financial performance Thailand shows sector-wide Thai developer EBITDA margins compression of 300 to 500 basis points over 2022-2024, with unlisted developer profitability Thailand experiencing even sharper erosion.
The gap between published benchmarks and operating reality stems from revenue recognition timing that inflates reported margins, land bank revaluation policies that mask cost pressures, and the divergence between listed developer Thailand financials (boosted by REIT spin-off income) and unlisted developer profitability Thailand (carrying full capital deployment costs). The TSIC 68 sector recorded approximately USD 27.93 billion in developer revenue Thailand 2024, with operating profit Thai developers earned declining to approximately USD 5.68 billion – as documented in our Thailand Real Estate Sector (TSIC 68).
1. Why your Thailand Real Estate Financial Benchmarks impact Thai developer EBITDA margins
I have spent the better part of a decade helping institutional investors, PE funds, and corporate development teams figure out what Thai developer EBITDA margins actually are – not what filings suggest. Growth equity mandates evaluating Thai property stock performance SET data for acquisition targets. Family offices assessing net profit margin Thai real estate yields. Infrastructure funds screening property developer profitability Thailand across EEC platforms. The common thread: nearly all arrive with margin models calibrated to a cycle that no longer exists.
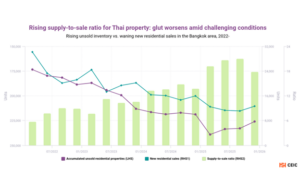
The 35 SET listed property companies Thailand reported a combined net profit margin to revenue ratio that dropped to 9.3% by September 2024, down from 11.6% at end-2023 and 13.1% in 2022. This margin compression Thai developers experienced is structural, not cyclical. Fierce market competition compressed gross profit margin Thai developers earned to a four-year low of 30.6% across the 12 largest listed developers.
2. Thai Developer EBITDA Margins by Segment: The 2022-2024 Data
2.1. Developer financial performance Thailand & Thai developer EBITDA margins comparison
| Developer Segment | 2022 EBITDA | 2023 EBITDA | 2024 EBITDA | Delta (bps) | Trend |
| SET-Listed Top 10 (Sansiri, AP, LH) | 28-32% | 25-28% | 22-26% | -400 to -600 | Compressing |
| SET-Listed Mid-Cap | 22-26% | 19-23% | 17-21% | -400 to -500 | Compressing |
| Unlisted (Bangkok Core) | 18-24% | 15-20% | 12-18% | -500 to -700 | Sharp decline |
| Unlisted (Provincial / Resort) | 15-22% | 12-18% | 10-16% | -400 to -600 | Distressed |
| Industrial / EEC Logistics | 20-25% | 21-26% | 22-27% | +100 to +200 | Expanding |
Dataset Provenance: Aggregated via Datagent Financial Intelligence Platform, Q1 2026. Thai developer EBITDA margins calculated from audited financials (listed) and DBD-filed reports (unlisted). Ranges reflect interquartile distribution.
2.2. COGS Ratio Real Estate Thailand: Why 57% Is the Critical Threshold
The COGS ratio real estate Thailand developers carry directly determines their margin headroom. The TSIC 68 sector recorded approximately USD 15.84 billion in Cost of Goods Sold against USD 27.93 billion in developer revenue Thailand 2024 – a sector-wide COGS ratio of approximately 57%. This operating profit Thai developers threshold means every 1% increase in input costs translates to roughly 230 basis points of Thai developer EBITDA margins compression.
For SET listed property companies Thailand with multi-project pipelines, construction procurement at volume-based pricing secures 8% to 15% material cost advantages. Unlisted developer profitability Thailand suffers because single-project operators procure at spot-market rates that include contractor risk premiums – widening the COGS ratio real estate Thailand gap between listed and unlisted by 5 to 8 percentage points.
3. What Drives Margin Compression Thai Developers Face: The 4-Layer Reality
3.1. Revenue Recognition Timing Effects on Thai developer EBITDA margins
Thai developers under TFRS recognize revenue using percentage-of-completion for presales and point-of-transfer for completed units. This creates structural timing mismatches that inflate reported Thai developer EBITDA margins during active development phases by 500 to 800 basis points versus full-cycle realized margins. Property sector earnings Thailand snapshots taken during development phases systematically overstate sustainable profitability.
3.2. Land Bank Carry Costs and Thai developer EBITDA margins Compression
Land bank financing costs consumed 3.5% to 5.5% of revenue for unlisted Bangkok developers in 2024, versus 1.5% to 2.5% for listed developer Thailand financials that benefit from treasury income and REIT distributions. This holding cost inflation is heavily driven by prolonged approval timelines and strict compliance requirements embedded within Bangkok zoning laws. To accurately assess this balance sheet impact, financial analysts must deploy specialized frameworks such as Thai land bank valuation methods rather than relying solely on superficial cost metrics. Thailand’s policy rate moved from 0.50% in early 2022 to 2.50% by mid-2023 before easing to 2.25%, widening this carry cost differential materially. Developer balance sheet analysis Thailand must account for this hidden margin diluter impacting Thai developer EBITDA margins.
3.3. Marketing Efficiency and Gross Profit Margin Thai Developers Variance
Listed developers spend 4% to 6% of revenue on sales and marketing; unlisted developers in the same markets spend 7% to 11%. This marketing cost pressure intensifies significantly when institutional capital and foreign entities enter joint-venture structures governed by thailand real estate investment frameworks. This structural disadvantage compresses gross profit margin Thai developers earn by 200 to 400 basis points, heavily weighing on overall Thai developer EBITDA margins as customer acquisition costs rise and pricing power drops in a soft market.
3.4. Construction Procurement and Real Estate Development Profitability Thailand
Volume-based procurement gives SET listed property companies Thailand an 8% to 15% construction cost advantage. This capital deployment efficiency is further highlighted in detailed comparative metrics from our comprehensive TSIC 68 sub-sector analysis, which contrasts performance dynamics between Thailand REITs and direct private development models. On a 57% COGS base, a 10% procurement premium translates to approximately 570 basis points of real estate development profitability Thailand compression – enough to move an unlisted developer from viable to structurally unprofitable in terms of Thai developer EBITDA margins.
4. Healthy Developer Valuation Metrics and Thai developer EBITDA margins Benchmarks
4.1. Residential Developer Margins Bangkok
Sustainable residential developer margins Bangkok range from 18% to 24% in Thai developer EBITDA margins for listed firms, and 12% to 18% for unlisted. Viability requires presale rates above 60% before construction. The 70% mortgage rejection rate in the mass-market segment has compressed residential developer margins Bangkok for projects priced below THB 3 million per unit.
4.2. Industrial Real Estate Margins Thailand EEC
Industrial real estate margins Thailand EEC corridor represent the only TSIC 68 sub-segment where property developer profitability Thailand improved over 2022-2024, reaching 22% to 27% in Thai developer EBITDA margins. China+1 manufacturing relocations, BOI-promoted data centers, and e-commerce infrastructure are structural demand drivers.
4.3. Thai Property Stock Performance SET: What Market Multiples Tell You
Thai property stock performance SET data shows the real estate development industry trading at P/E ratios of 15.5x as of April 2026, higher than the 3-year average of 11.2x – suggesting investors are pricing in recovery despite developer revenue Thailand 2024 declining. Developer valuation metrics Thailand investors should monitor include P/B ratios (currently below 1.0x for most mid-caps, indicating net asset value discounts), EV/EBITDA spreads between listed and unlisted comparables, and dividend yield sustainability given net profit margin Thai real estate compression affecting Thai developer EBITDA margins.
5. Frequently Asked Questions
5.1. What is a healthy EBITDA margin for Thai real estate developers in 2026?
Sustainable full-cycle Thai developer EBITDA margins range from 18% to 28% for listed firms and 12% to 22% for unlisted, depending on segment. The critical distinction: development-phase margins are inflated by revenue recognition timing by 500-800 bps versus full-cycle realized margins. Investment committees should benchmark developer financial performance Thailand against full-cycle metrics, not point-in-time snapshots from property sector earnings Thailand reports.
5.2. Why are unlisted developer profit margins lower than listed developers in Thailand?
Three structural factors drive the unlisted developer profitability Thailand gap: land bank carry costs (3.5-5.5% of revenue vs. 1.5-2.5% for listed), marketing efficiency (7-11% spend vs. 4-6%), and construction procurement pricing (8-15% volume discount disadvantage). Combined, these compress unlisted gross profit margin Thai developers earn by 500 to 900 basis points versus SET listed property companies Thailand, directly depressing unlisted Thai developer EBITDA margins.
5.3. How do I benchmark Thai developer financials against ASEAN regional peers?
Real estate profit margins Thailand sit mid-range in ASEAN: below Singapore-listed developers (higher pricing power, mature REIT ecosystems) but above Vietnamese and Indonesian developers (higher construction cost volatility, greater regulatory complexity). The most meaningful Thailand real estate financial benchmarks comparison is within Thailand by listing status and asset segment using Datagent’s TSIC 68 financial analysis database to evaluate actual Thai developer EBITDA margins.
5.4. Which Thai real estate segment has the best EBITDA margins in 2026?
Industrial real estate margins Thailand EEC is the only sub-segment where Thai developer EBITDA margins improved over 2022-2024, reaching 22-27% EBITDA. This reflects structural demand from China+1 relocations and data center investments. Residential developer margins Bangkok have compressed most sharply, with unlisted firms now operating at 12-18% – barely above viability thresholds for single-project operators.
5.5. What is the typical COGS ratio for Thailand real estate developers?
The COGS ratio real estate Thailand developers carry averaged approximately 57% of revenue sector-wide in 2024. However, this varies significantly: listed developer Thailand financials show COGS ratios of 52-58% (benefiting from procurement scale), while unlisted developers face 58-66% COGS ratios due to spot-market pricing. Developer balance sheet analysis Thailand must separate these structural cost differences to avoid misleading peer comparisons when reviewing Thai developer EBITDA margins.
If your financial model for Thailand real estate is built on generic industry reports, it is likely missing the ground-level data that separates viable opportunities from underperforming assets. Book a 15-minute call with Datagent’s real estate analytics team to receive a framework calibrated to your specific investment thesis.
Written by: Jey Nguyen, Senior Analyst at Datagent | [email protected]
About Datagent
Datagent is the trusted intelligence partner for company data and industrial insights across Southeast Asia and India. We integrate firmographics, verified corporate financial performance, and localized micro-economic indicators into a single, structured intelligence layer – helping institutional investors, multinational corporations, and strategy consultants mitigate supply chain risk and accelerate investment decisions across 11 dynamic economies.
Datagent delivers a total of 61 core firmographic fields, comprising 22 operational variables and 39 standardized financial indicators, with full historical coverage across 2022-2024.
This report is for informational purposes only and does not constitute financial advice or an invitation to invest. Decisions should be based on independent research and professional consultation.